The Road Traveled
 If you follow a stony path curving around a small hill that reveals a much larger one behind. You scramble and then climb, stretching one hold as you reach for the next. A realization dawns that this is much higher than you were expecting. The air is sparse and cool as you reach the peak. Below you, all of Thunder’s Place is stretching into the distance. This is a paean to one of those peaks you may have never seen before.
Statistics are boring. Everyone knows that. Well almost everyone. But what was your routine 6 months ago? A bit fuzzy, is it? Was it working? And when you are measuring now are you sure it’s different from before. You noted it down, right? Yeah, maybe it’s in a file in a folder somewhere and you hid it away and can’t find it. Maybe you’re super organized and everything is in a spreadsheet but are you tracking your routines against your gains? Can you visualize it? Something like this.

hunglikeagerbil logs well. He will be able to look back and see what routine was best for growth. The spoiler is it looks like his fulcrum stretch routine really kicked things into high gear for length gains and it’s probably his least time consuming routine.
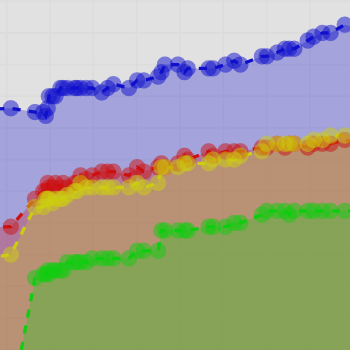
If you click on the Top Stats link in PE stats, you’ll be presented with the people making most use of the system. Trekker is sitting at the top. And this is a flavor of what his stats show.

Trekker’s routine hasn’t changed for a while and you can clearly see the newbie gains phase and then the slower later gains but this is where perseverance pays off, he’s kept going and he keeps gaining. All those small steps add up to about 1” gain in BPEL after his newbie gains stopped. And he’s still going.
Top Stats shows what consistency and hard work does in PE and all the people listed, even though many don’t post, are doing the kinds of things that we should be emulating.
RyanPL was tracking his weight and it shows a rather dramatic shift towards his ideal weight in just over four months. There’s power in setting a commitment in public.

You can track gains and routines. If you add periods you are using certain routines, they will show on the graphs. Create a thread in the Progress Reports forums and link it to the routine and then edit the first post as needed. If you see a routine you like, you can clone it from other people (or from yourself) and then edit to your liking.
Stats can vizualise your health. It’s not a Garmin watch or an Oura ring yet. Given your height and weight, BMI will appear. With the combination of height and waist circumference, it will generate a ratio (WHtR) which is linked to metabolic health. The combination of weight and waist circumference will calculate your body fat more accurately than BMI. All that and snazzy graphs to help it make more sense.
If you want a broader view, check the analysis page. This shows an analysis of all stats.