Originally Posted by wibble
Interesting post, but this:This doesn’t come "from the above data", it comes from the definition of the normal distribution! http://en.wikip edia.org/wiki/N … dence_intervals
Actually it is based on the data.
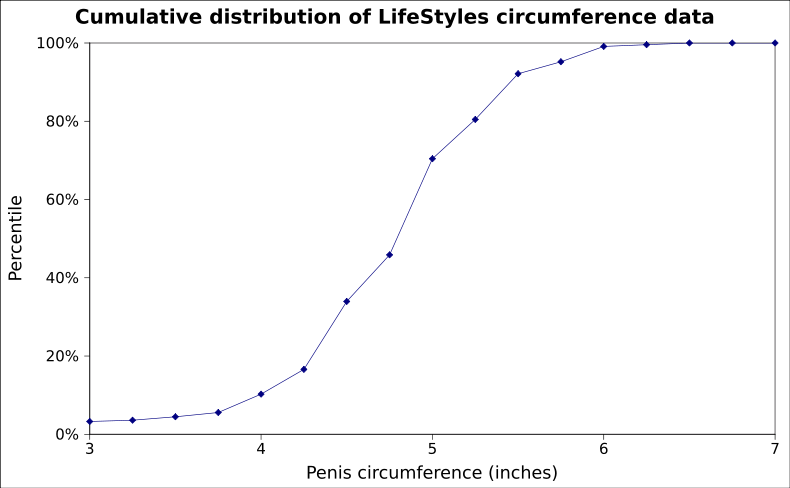
What the writer meant was that the measured data closely approximates a normal distribution, centered on the mean.
If you look at the charts, it is not exact, but it is close, for both girth and length.
Based on the measurements from that particular survey, penis girth and length very closely follow a normal distribution.
Now lets look at the following hypothetical penis lengths:
1
1
1
1
1
1
1
1
1
1
4.5
5
5
5
5.5
13
The Mean is 3, and the SD is 3.27
If the samples constitute a normal distribution, we would expect 68% to be within +/- 1 SD.
However, we find that 93.75% are within 1 SD, and 6.25% are more than 3 SD above the mean.
There should only be 3 in 10,0000 outside of +/-3SD (meaning zero in a sample this size).
Furthermore, in a normal distribution, a close approximation of half the values are above the mean and half below. In the distribution above, 62.5% are below the mean.
The distribution above is decidedly not normal.
Kdong Starting: 7.1 x 5.125 vol = 14.84 cu. in. Current: 7.1BPEL 5.5 MSEG = 17cu. in. GOAL --> 8.5 x 6.5 vol: 28.6 cu. in.
Took Time off, lost some gains-- Girth cemented
No PE since 2015 -- starting back up
